Cloud Security Architecture Diagram: Map Controls to Reduce Risk
A visual model reveals hidden trust boundaries and misconfigurations that text-based policies often obscure during cloud infrastructure design.

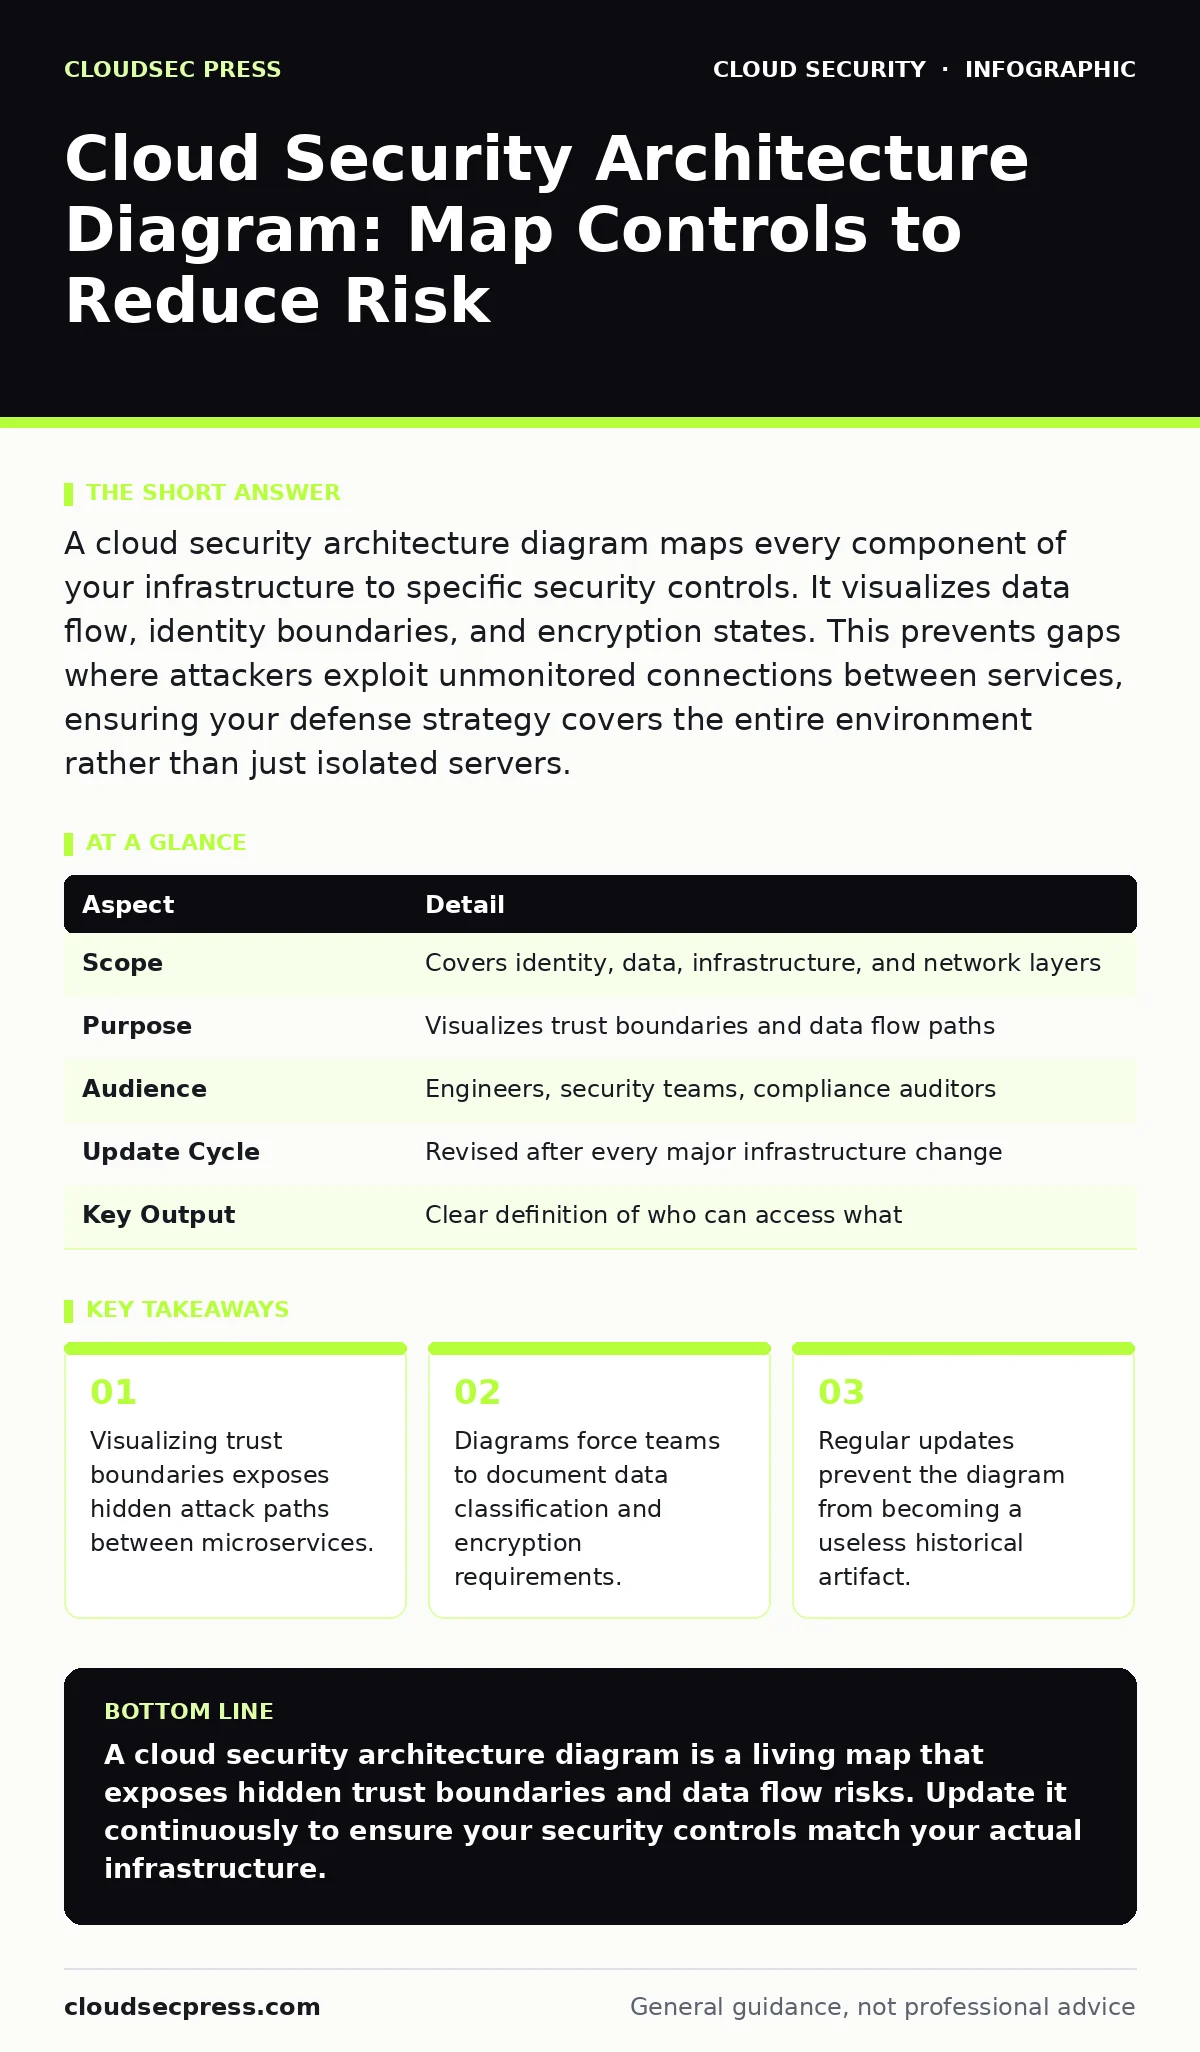
A cloud security architecture diagram maps every component of your infrastructure to specific security controls. It visualizes data flow, identity boundaries, and encryption states. This prevents gaps where attackers exploit unmonitored connections between services, ensuring your defense strategy covers the entire environment rather than just isolated servers.
The Architecture of Trust
Imagine a bank where guards check IDs at the front door but ignore the side windows, basement vents, and roof access points. A cloud security architecture diagram acts as the complete floor plan for your digital bank. It shows not only the walls but every door, window, and conduit. This visual map defines how data moves, who can touch it, and where security controls sit. It turns abstract policy into concrete engineering requirements.
Cloud security architecture is the structured arrangement of controls that protect data and services in cloud environments. It integrates identity management, network segmentation, encryption, and monitoring into a single cohesive model. You design it to ensure that no single failure compromises your entire system. The diagram is the primary tool for communicating this design to engineers, auditors, and executives. It reveals dependencies that text descriptions often hide.
| Aspect | Detail |
|---|---|
| Scope | Covers identity, data, infrastructure, and network layers |
| Purpose | Visualizes trust boundaries and data flow paths |
| Audience | Engineers, security teams, compliance auditors |
| Update Cycle | Revised after every major infrastructure change |
| Key Output | Clear definition of who can access what |
How the Model Works in Practice
The architecture functions by defining trust boundaries. A trust boundary is the line where data moves from a trusted environment to an untrusted one. Every time data crosses this line, a control must verify its integrity and authorization. Your diagram must show these crossings explicitly. If you draw a line from a public API to a private database, you must show the firewall rule, the identity check, and the encryption tunnel on that line.
Data flow is the second pillar. You must map every journey data takes from creation to deletion. This includes backups, logs, and analytics pipelines. If a service sends logs to a storage bucket, that connection is part of your architecture. Missing it in the diagram means missing the security control. This often leads to exposed storage buckets because no one realized that bucket held sensitive logs. The diagram forces you to account for every destination.
Identity is the third pillar. In cloud environments, identity replaces the network perimeter. Your diagram should show which identities (users, services, roles) interact with which resources. It must distinguish between human users and machine accounts. Machine accounts often have broader permissions than necessary. Visualizing these relationships helps you spot over-privileged service accounts that could facilitate a SaaS account takeover if compromised. The model connects identity to action.
What People Usually Get Wrong
Many teams treat the diagram as a static poster. They draw it once during the initial design phase and never update it. This creates a dangerous gap between reality and documentation. When engineers add new services without updating the map, they create shadow IT. These unauthorized or unmanaged services operate outside your security controls. The diagram becomes a lie that gives false confidence. You must treat the diagram as a living document that evolves with your infrastructure.
Another common error is focusing only on external threats. Teams draw thick walls around the perimeter and assume the inside is safe. This ignores insider threats and compromised credentials. Your architecture must include internal segmentation. You should draw controls between your own services, not just at the edge. If one microservice is compromised, the attacker should not be able to move laterally to your database. The diagram should show these internal checkpoints clearly.
A third mistake is omitting the management plane. Many diagrams show the data plane (user traffic) but forget the control plane (administrative actions). Attackers often target the control plane to change firewall rules or create new admin users. If your diagram does not show who can modify the security controls themselves, you have a blind spot. Include the identity provider, the logging service, and the configuration management tools. These are the keys to the kingdom.
Visualizing the Layers
A useful diagram breaks the environment into logical layers. The identity layer sits at the core. It shows your identity provider and how it authenticates requests. Next is the network layer. It depicts virtual networks, subnets, and firewalls. The compute layer follows, showing virtual machines, containers, or serverless functions. Finally, the storage layer shows databases and file systems. Each layer must have specific controls defined.
Connections between layers are where security happens. You must label every connection with its protocol and encryption status. A connection from the compute layer to the storage layer should be marked as encrypted in transit. If it is not, you have a vulnerability. The diagram should also show data classification labels. Mark which data is public, internal, confidential, or restricted. This helps engineers choose the right controls for each flow.
Building the Diagram Step by Step
Start with your identity provider. List every user group and service account. Define what each can do. Next, map your network topology. Draw your virtual networks and subnets. Add your firewalls and access control lists. Then, add your compute resources. Link each resource to the identity groups that can access it. Finally, add your storage resources. Connect them to the compute resources that read or write data.
Review every connection. Ask who can initiate it and who can accept it. Add encryption requirements for each link. Add logging requirements for each action. Share the draft with your engineering team. Ask them to find gaps. Iterate until the diagram matches your actual infrastructure. Store the diagram in your version control system. Update it whenever you change your architecture. This keeps the documentation accurate and useful.
See also: 7 Payment Card Theft Mistakes That Leave Your Business Open · Cloud Migration Security Checklist: Stop Data Leaks Before Launch
Real-World Application
Suppose your company launches a new customer portal. The portal runs on serverless functions and reads data from a database. Without a diagram, an engineer might connect the function directly to the database using static credentials. This creates a risk. If the function code is compromised, the attacker has direct database access. A proper architecture diagram would show an identity-based connection. It would mandate short-lived credentials and least-privilege access. This prevents the credential leak from escalating.
This scenario highlights the risk of insecure container images or serverless security risks if not properly scoped. The diagram forces you to define the boundary between the function and the database. It ensures you implement a security control at that boundary. This might be a private endpoint or an identity-aware proxy. The visual model makes the security requirement obvious before code is written.
Maintenance and Governance
A diagram is only useful if it is current. Assign ownership to a specific team or individual. They are responsible for updating the map after every change. Integrate the diagram review into your deployment process. No infrastructure change should be approved without an update to the architecture map. This ensures that new services are secured from the start. It prevents the accumulation of technical debt in your security posture.
Regular audits should compare the diagram against the actual environment. Use automated tools to verify that the connections shown in the diagram exist and that the controls are active. If a connection exists in reality but not in the diagram, flag it as a risk. If a control is in the diagram but not in reality, fix the configuration. This continuous feedback loop keeps your architecture aligned with your security goals.
Consider how this architecture supports other security efforts. For instance, a clear data flow map makes it easier to implement cloud backup strategies that protect against ransomware. It also helps identify exposed storage buckets before they are exploited. By maintaining a rigorous architecture diagram, you build a foundation that supports secure access service edge (SASE) implementations and other advanced frameworks. The visual clarity reduces ambiguity in policy enforcement.
Key takeaways
- Visualizing trust boundaries exposes hidden attack paths between microservices.
- Diagrams force teams to document data classification and encryption requirements.
- Regular updates prevent the diagram from becoming a useless historical artifact.
A cloud security architecture diagram is a living map that exposes hidden trust boundaries and data flow risks. Update it continuously to ensure your security controls match your actual infrastructure.
Frequently asked questions
How often should I update my cloud security architecture diagram?
Update it immediately after any significant infrastructure change or new service deployment to maintain accuracy.
Do I need a diagram for serverless applications?
Yes, serverless functions still have data flows and identity requirements that must be mapped to prevent insecure container images or configuration errors.
What tools should I use to create the diagram?
Use any clear vector graphics tool, but ensure the diagram is stored in version control alongside your infrastructure code for traceability.
How do I handle shadow IT in my architecture?
Regularly audit your cloud environment for unauthorized resources and add them to the diagram to bring them under security governance.
How this guide was produced: written by the CloudSec Press editorial team with AI assistance, checked against the public references listed below, and reviewed when the facts change. See our editorial policy or report an error.